Every site in Storeganise has an Overview tab that brings together the numbers that matter most about how that site is performing, from occupancy to revenue to who's moving in and out. This article explains what each of the five dashboard views shows you, in plain terms, so you know where to look for what.
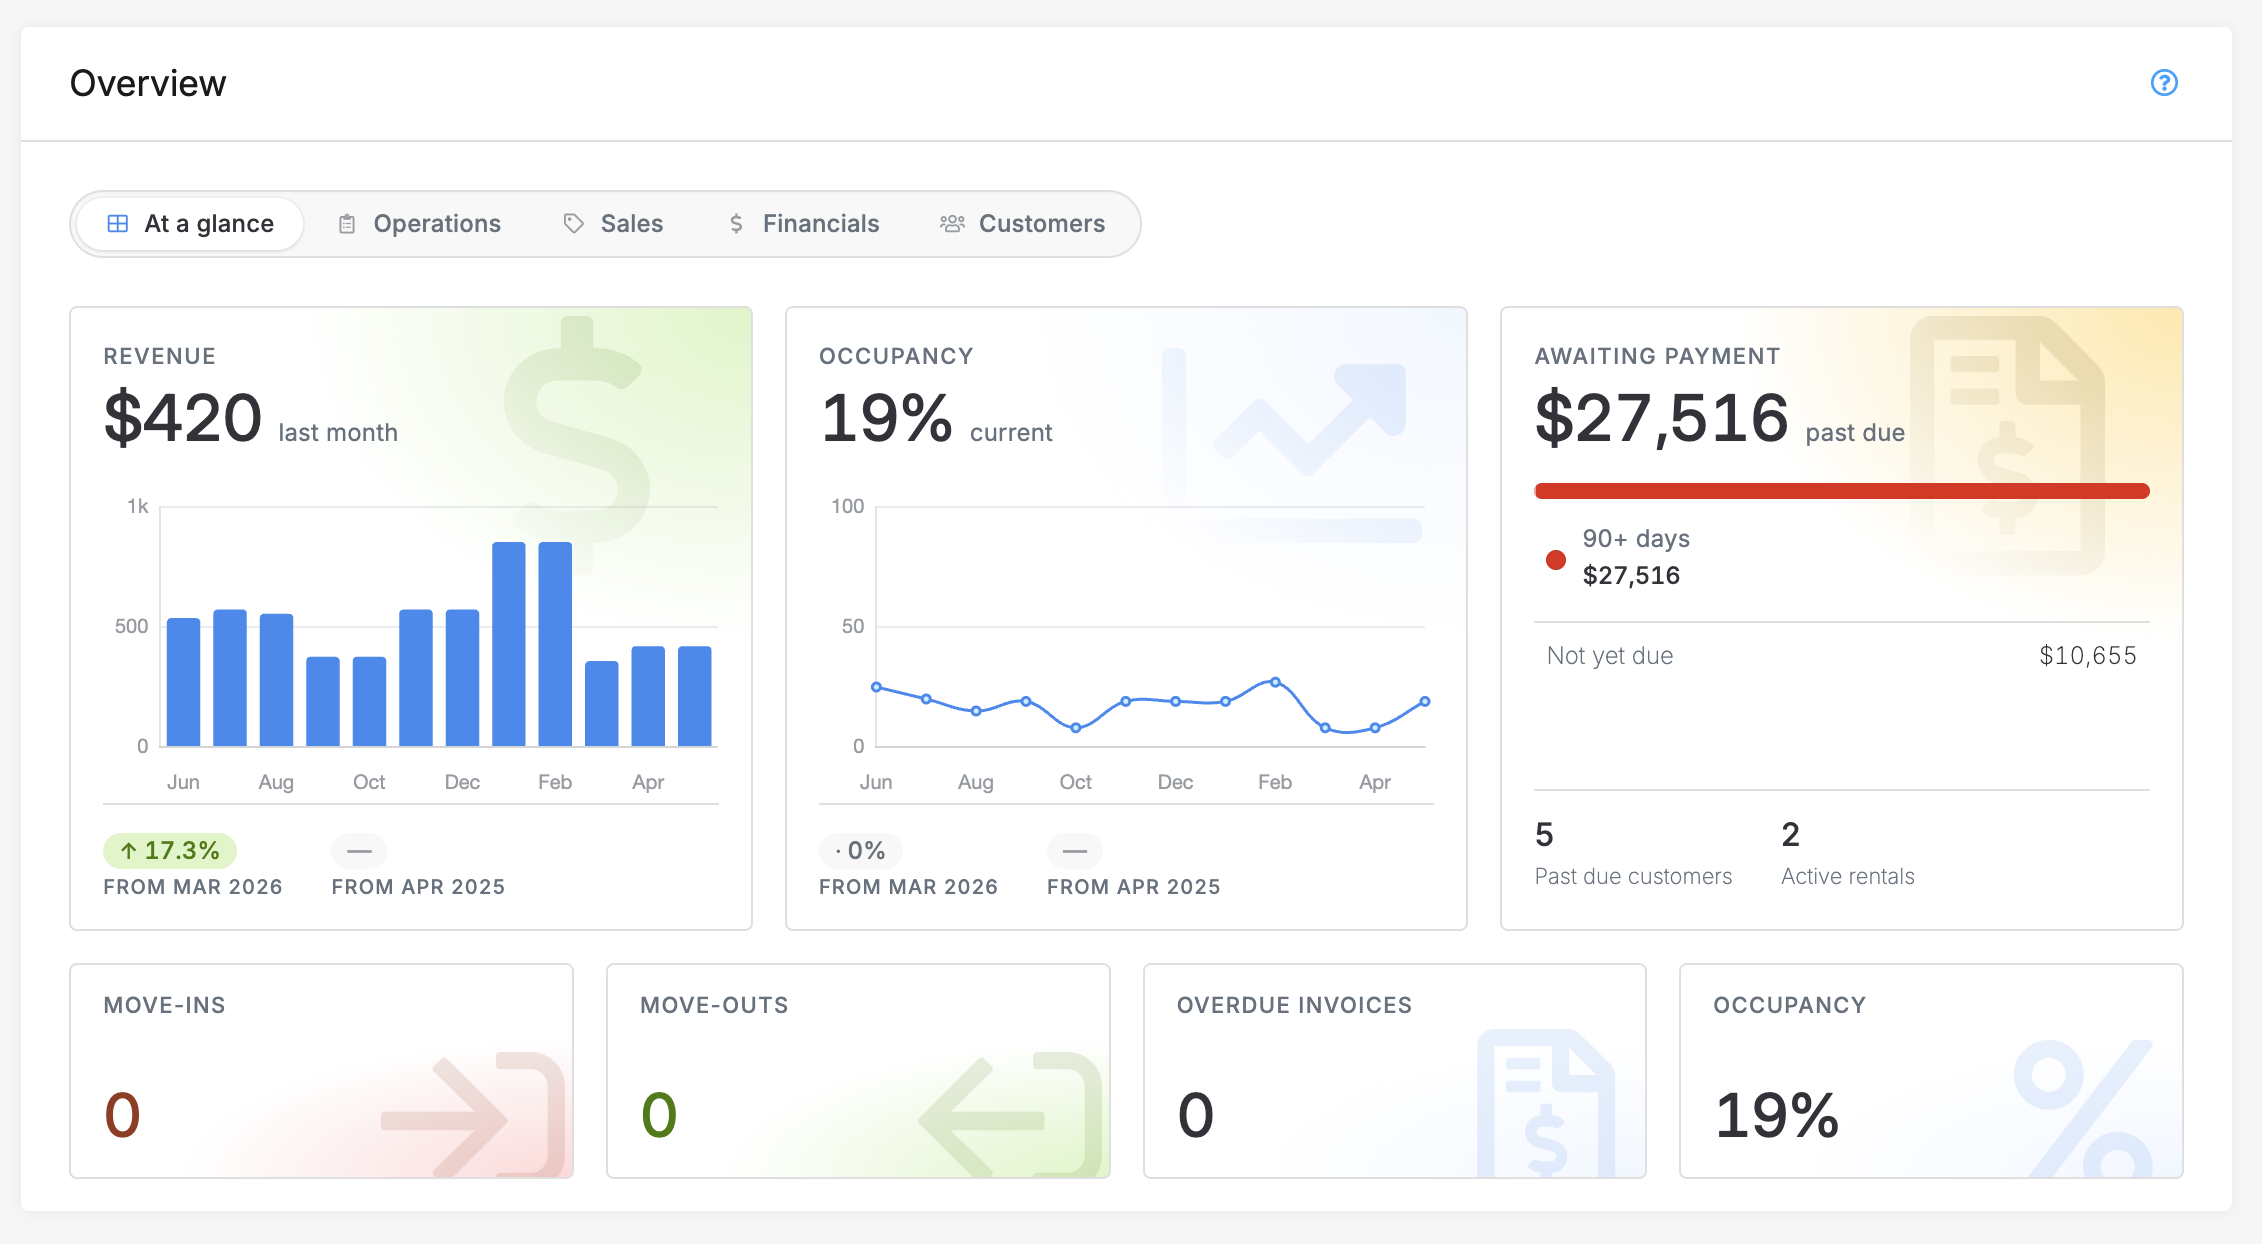
At a glance
Main overview tab
This is the quick health check for the site. It shows current occupancy, a 12-month revenue trend, how many customers have moved in or out so far this month, and how much money is currently overdue.
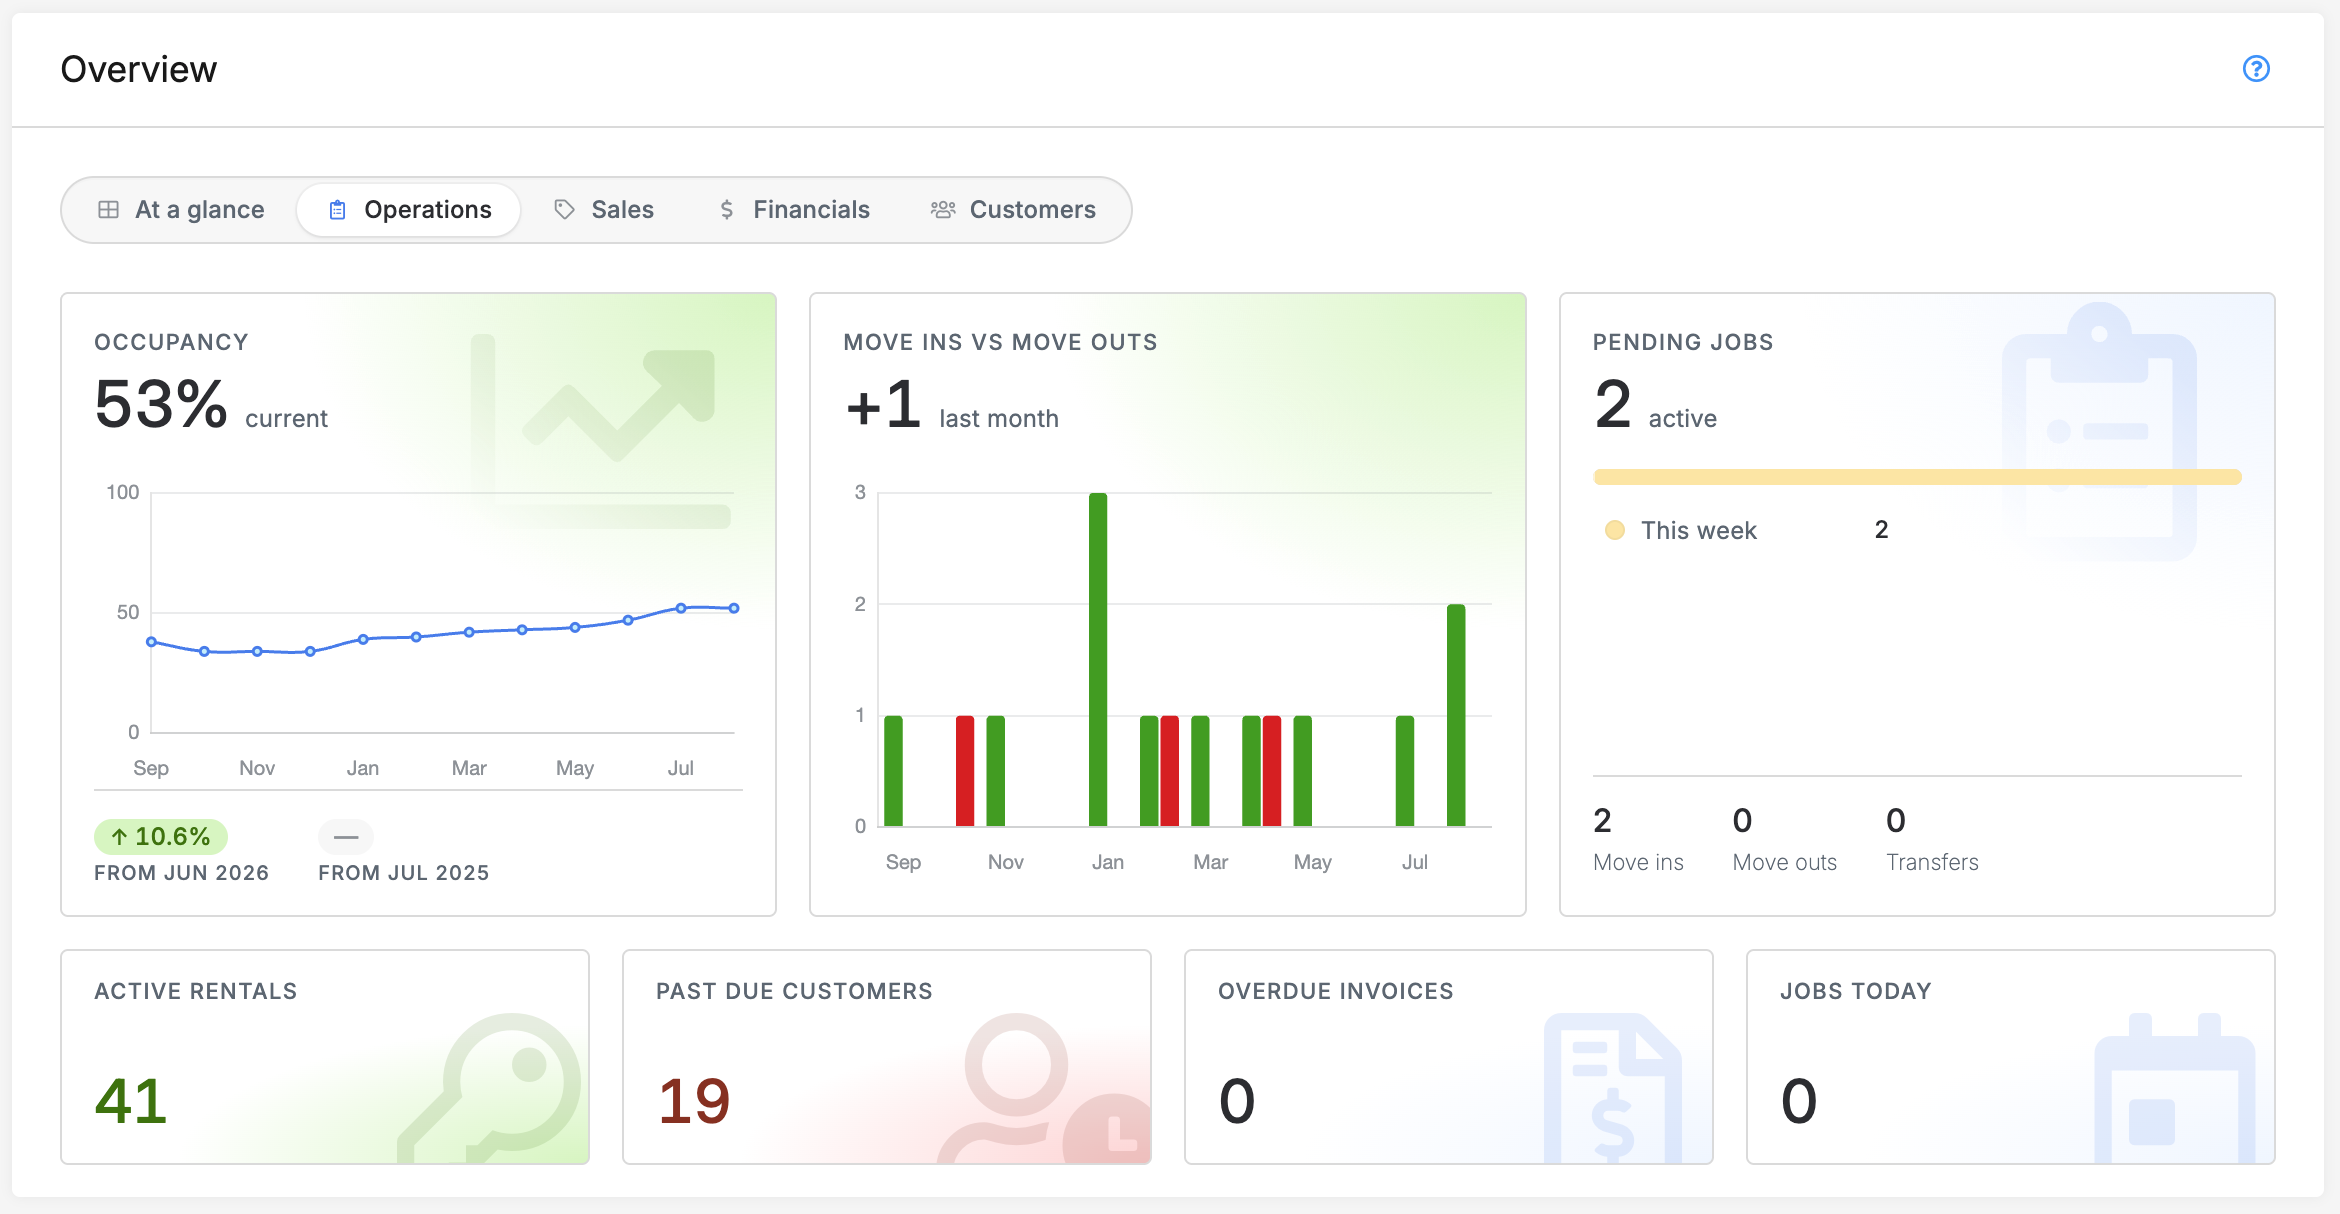
Operations
Operations tab
This view covers active rentals, a chart of move-ins and move-outs over the last 12 months, jobs that are still pending (grouped by how urgent they are), how many jobs are scheduled for today, and overdue invoices.
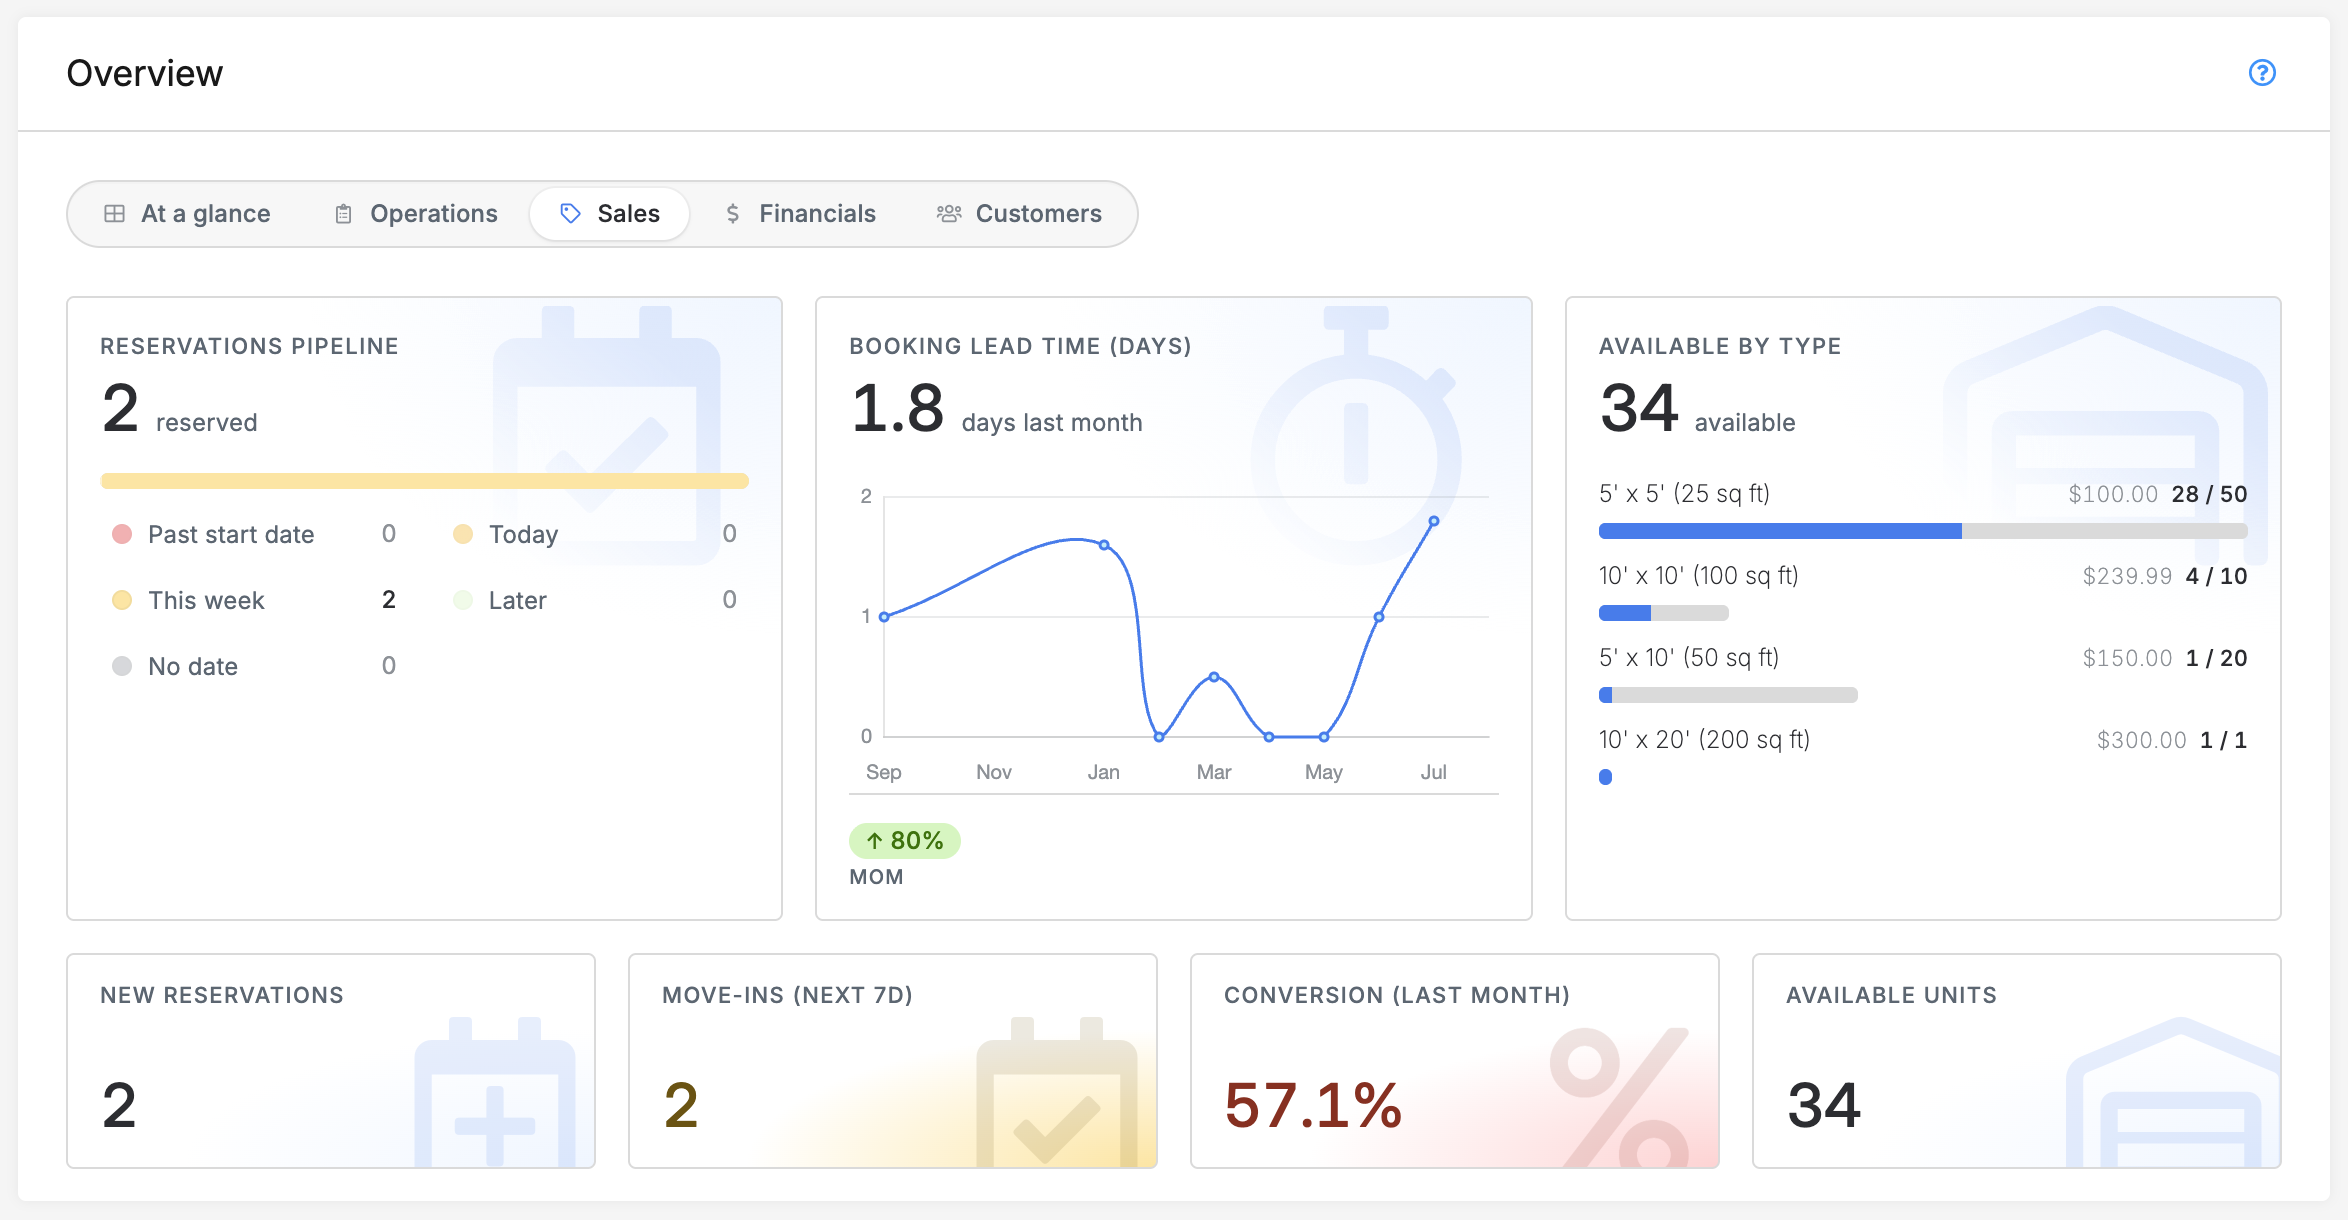
Sales
Sales tab
This view shows how many units are available right now, a breakdown of availability by unit type, the pipeline of upcoming reservations, how far in advance customers typically book, new reservations this month, and your conversion rate (the share of bookings that turn into paying customers).
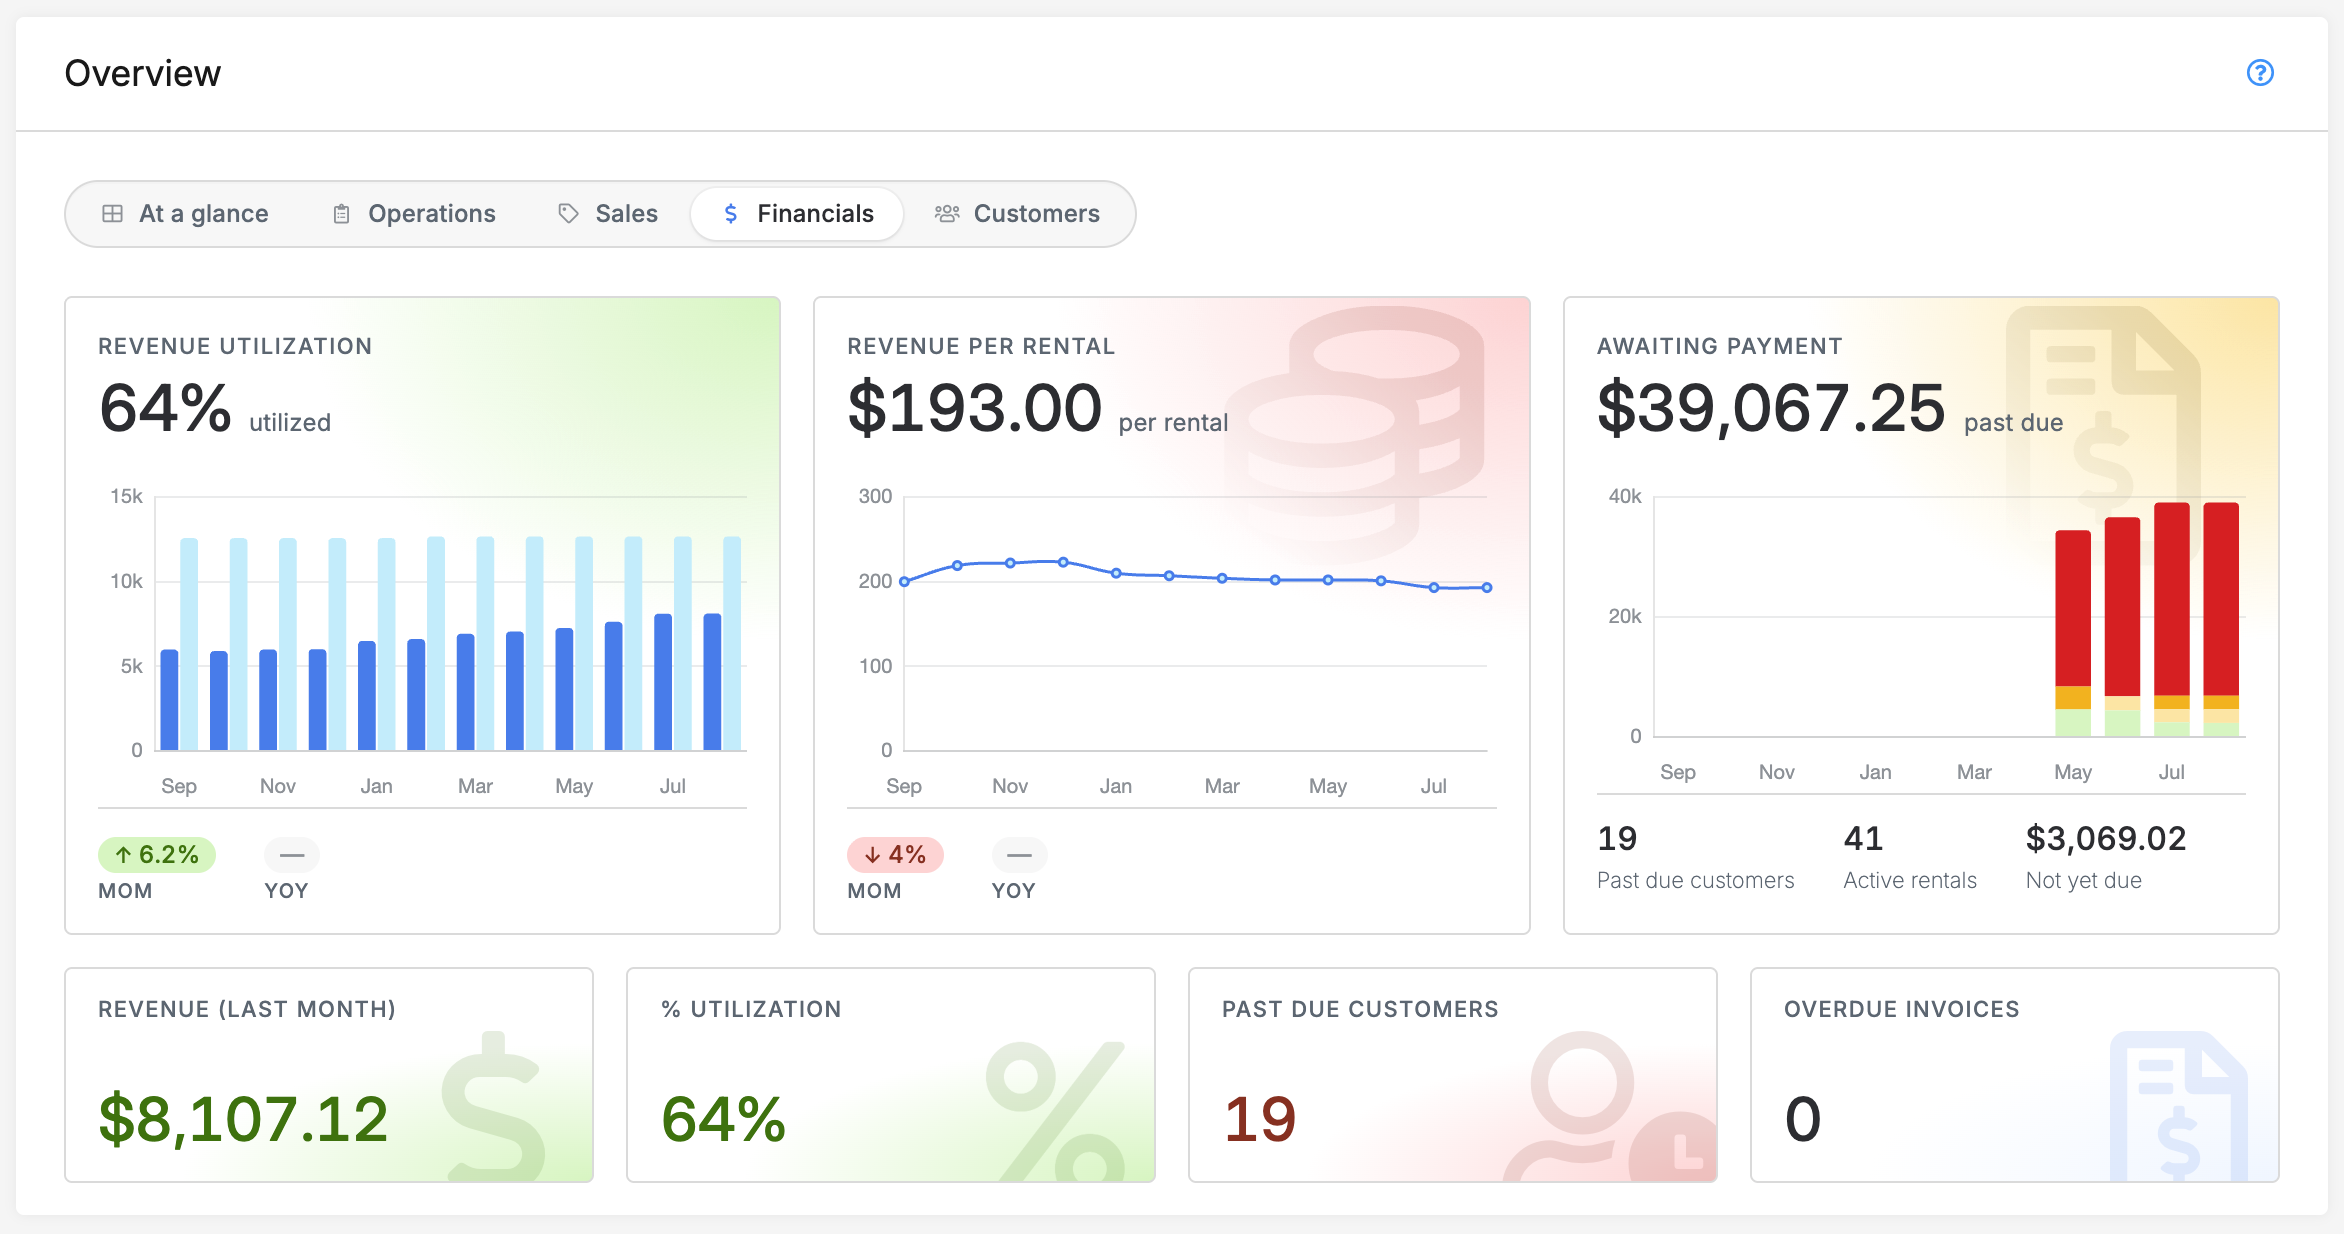
Financials
Financials tab
This view shows actual revenue against what the site could theoretically earn at full price (utilization), average revenue per rental, and how much money is awaiting payment, broken down by how overdue it is.
Customers
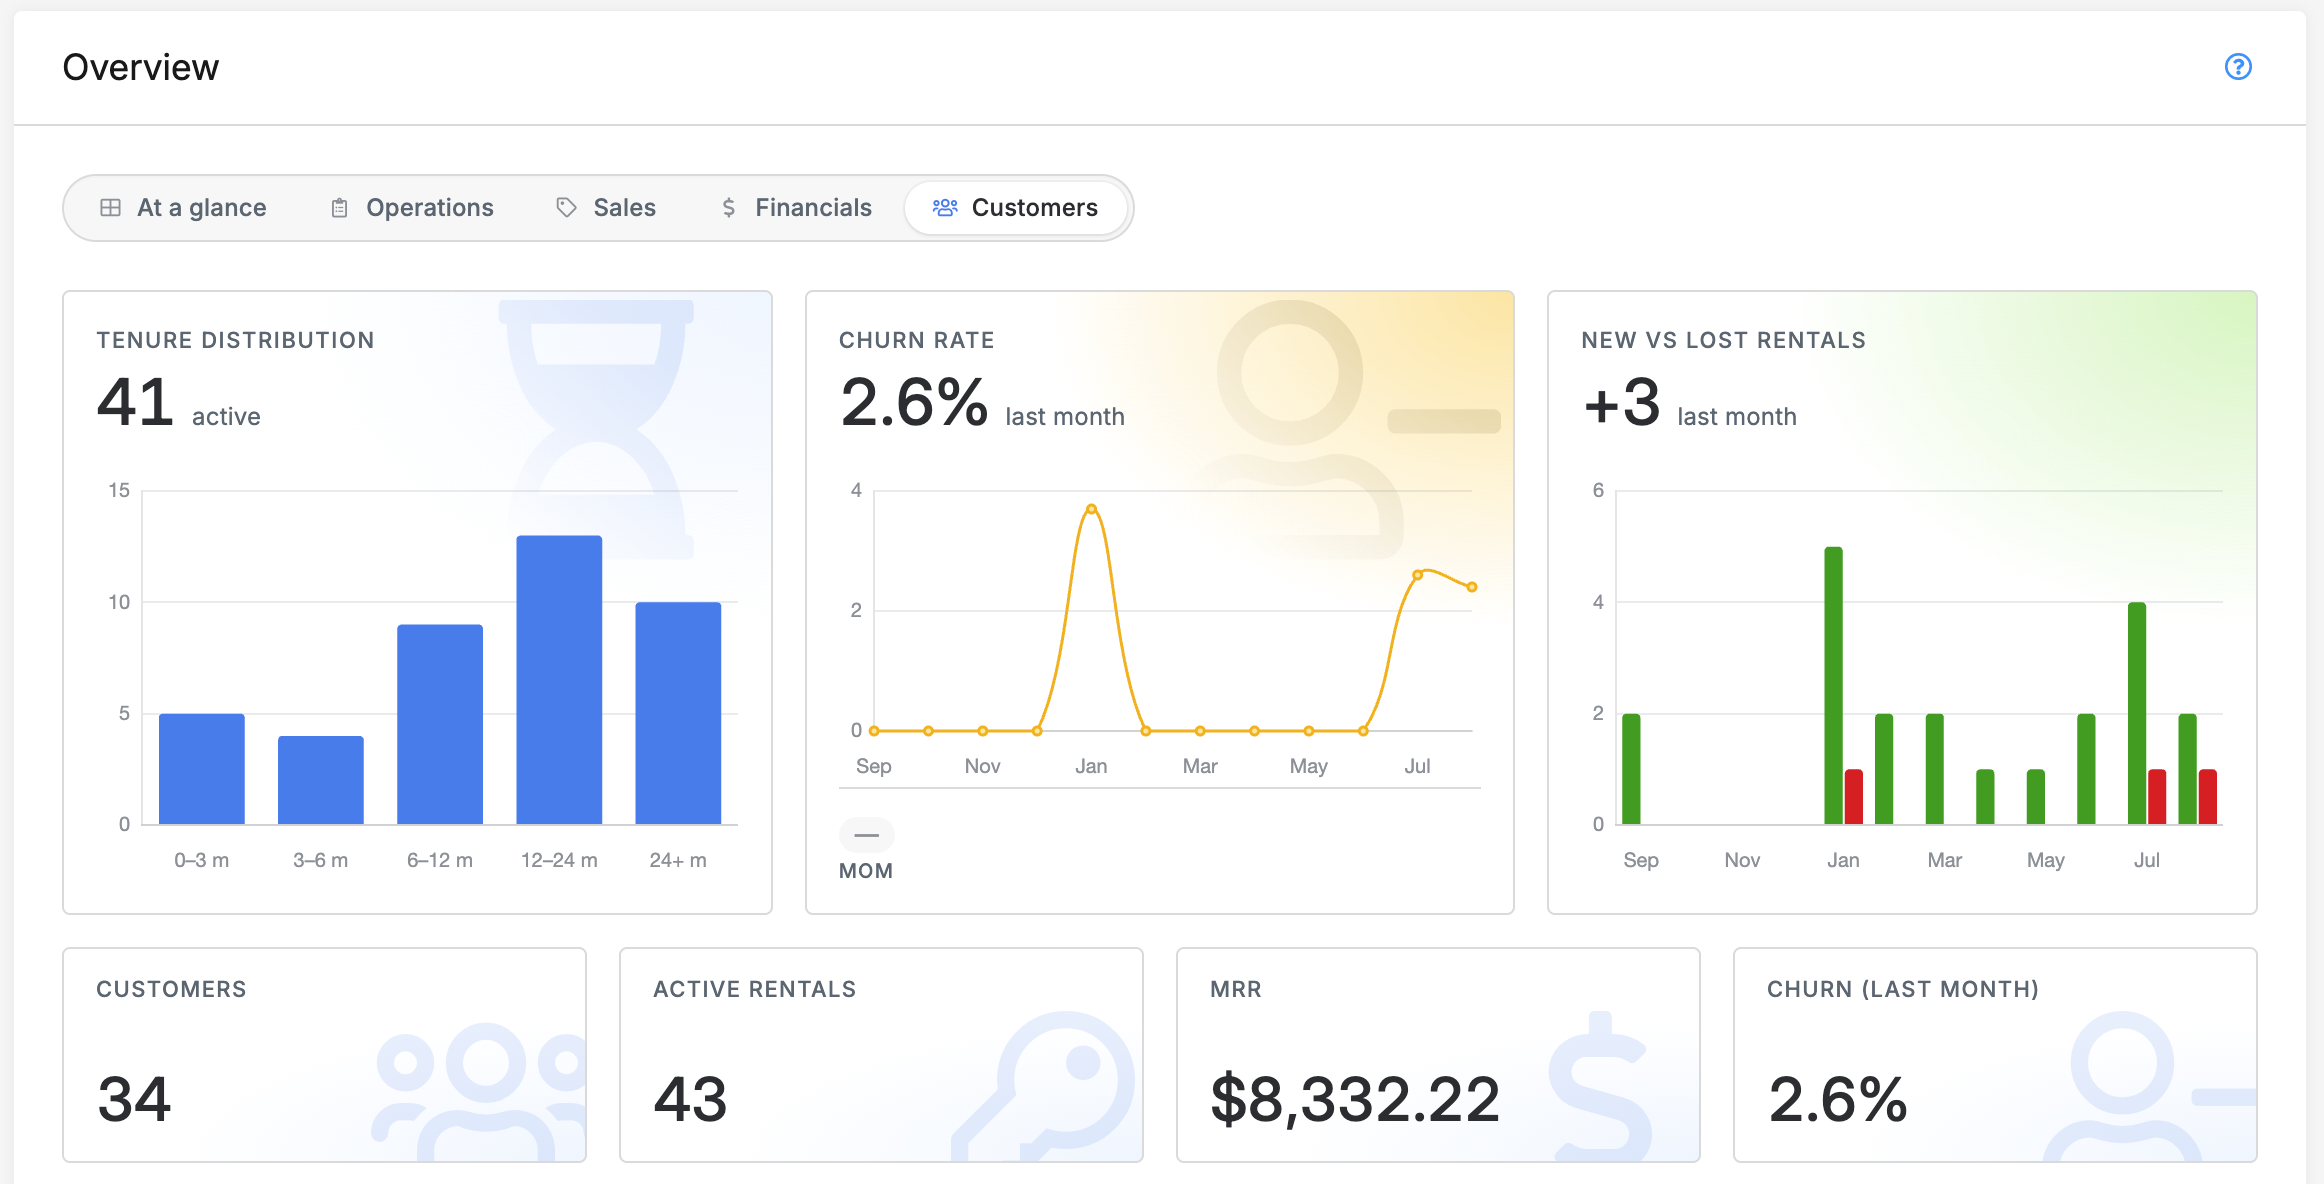
Customers tab (top 10 list not pictured here)
This view shows your total customer count, monthly recurring revenue, your top 10 customers by revenue, how long customers have stayed on average (tenure), your churn rate, and a comparison of new versus lost rentals.